Golden Door's Investment Calculator
Simplifying Your Research ProcessAt Golden Door, we use 5-6 investment tools on a regular basis. Besides a Bloomberg Terminal, most investment research tools online are quite affordable for retail and institutional investors. You might be familiar with products like Alpha Sense, Koyfin, Tikr and FinChat. Each product has its own specific use case. Sometimes you need to pull filings. Other times you need to read the news. Of course, some products even have spreadsheet add-ons so you can download financial data instantly. All of these tools save you a lot of time. However, I always found the most basic tasks were consuming too many minutes of my day. Specifically, opening up Yahoo! Finance to look up stock ticker data. Either the market cap, profit margins or something else simple. The same went for calculating returns for different ideas. Whether it was the cost of capital, the return on equity or the taxable gains. Context switching to even open a spreadsheet would eat away from my focus. So to my surprise, I realized no one had ever built a chrome extension tool for finance professionals. Specifically for quick data points. Something Bloomberg Terminals do well with multiple windows for news, stock data and calculations. Introducing Chrome’s Newest Investment CalculatorsNow if you are a Google Chrome Power User, you might have several chrome extensions installed today. They are a popular way to customize your browser experience. I use them for search, updating my CRM and more. But one thing I could never do was search for specific stock content. For example, I can type into Perplexity or Gemini for specific updates. But it wont give me everything I need in a second. This is why Bloomberg Terminals are so popular. Investors type in 2-3 commands and get the immediate information they need. So since I couldn’t find the perfect product, I built my own solution: Golden Door’s Investment Calculator. What’s missing from the financial marketplace todayIf you are a stock picker, you probably look at 30-40 tickers per week. It’s a bad habit for most of us. We are constantly consuming information, non-stop. Some will say we are students of the market. Others will say we are crazy. Either way, it’s an addiction. Personally, I think it’s pattern recognition. We’re all looking for great investments, while looking out for market changes. Which is why I built this investment calculator. The context switching between 10-15 tickers per day was too much. And I always found myself searching for the same 2-3 stats. Most of the time it was the stock price and market cap. Sometimes I needed a refresher on what the company did.
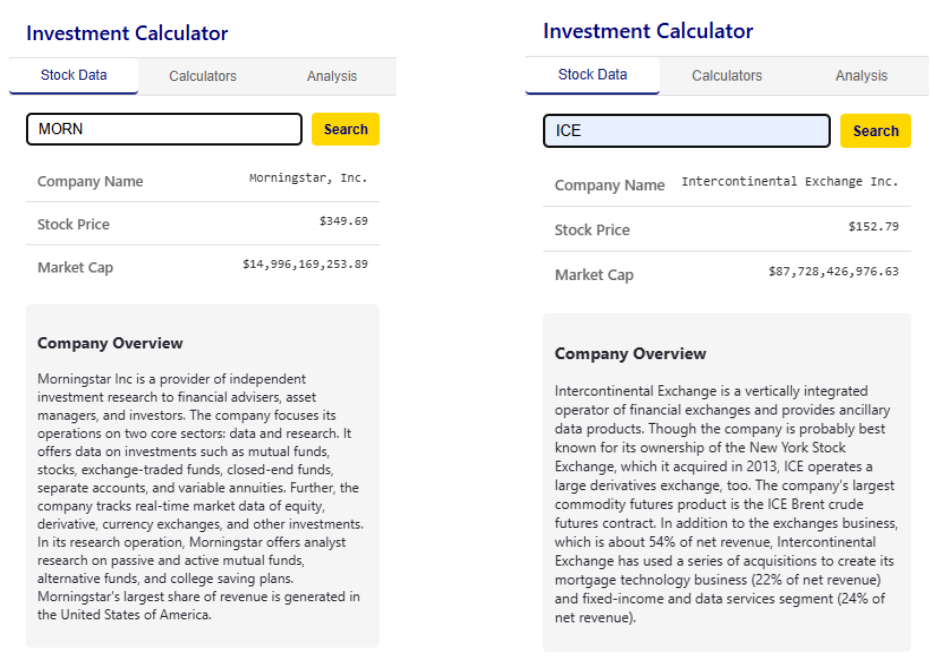
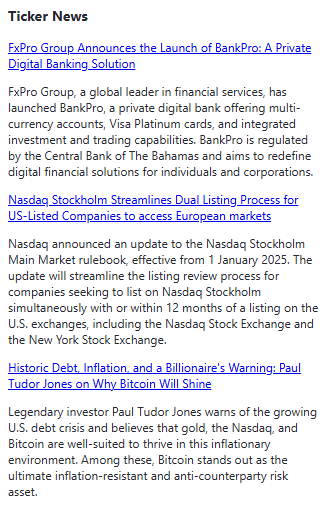
So the first thing I did was build a dashboard to get a quick update for those exact figures. Tickers are easy to remember but price and market cap not so much. These stats were why I opened up Yahoo! Finance all the time. After viewing the key stats, I would switch off to the Profile page for a company description. It gives me enough information about the company to make my next decision. I also added a related news section to find the latest articles. You never know what interesting articles can pop up with a quick search. It might be an earnings release, an insider transaction or something industry related. Useful if you need a quick snapshot when looking at 4-5 tickers fast.
Building the Investment CalculatorNow many investment websites will have some type of financial calculator. Either a personal finance blog, financial advisor toolkit or an investment research portal. Each has a different use case. However, most of these calculators were too basic for me. It’s nice to know how you can compound returns or how much to save for retirement. But this has a limited use case as an investor. Instead I needed some functionality that was only available in a spreadsheet. I need concepts of how to value stocks and what will drive specific variables. Which is why I built two additional tabs in this tool: Calculators & Analysis
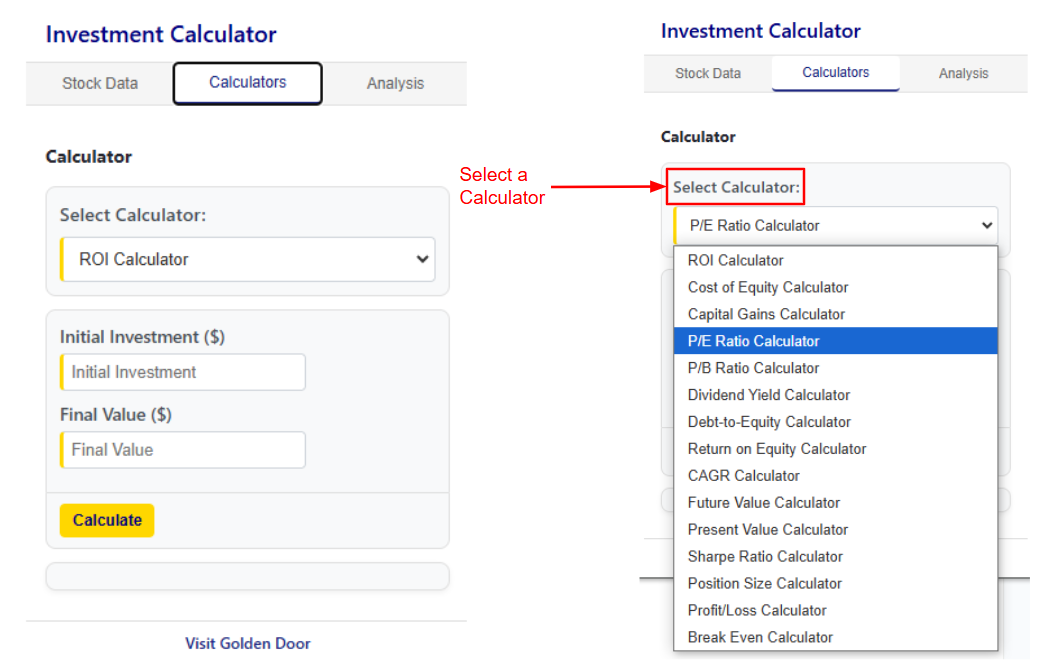
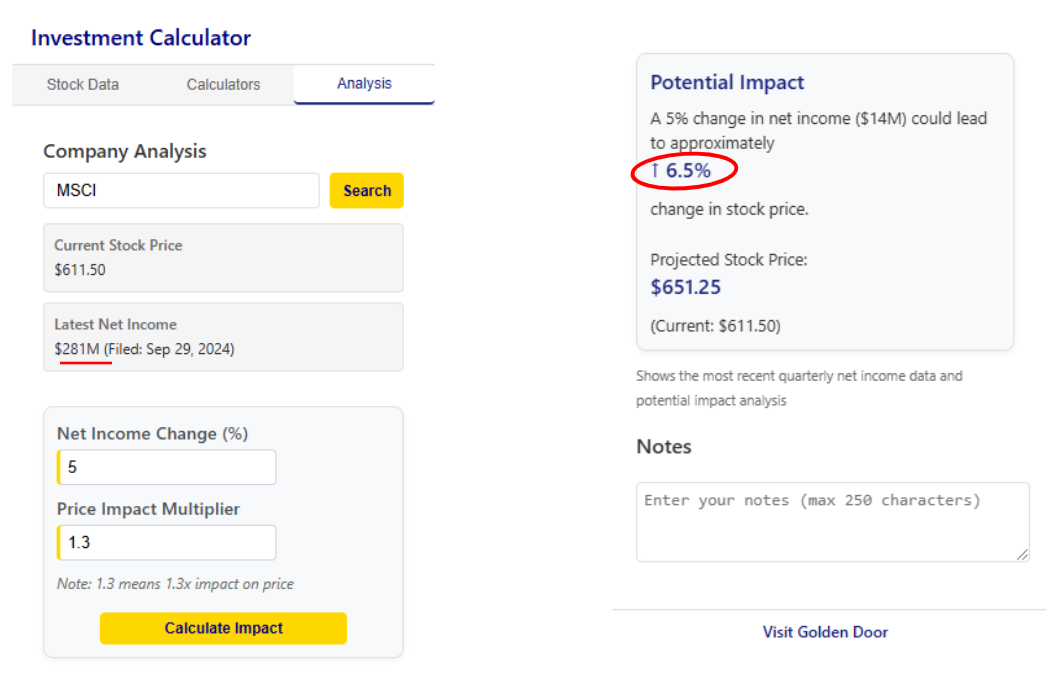
In the second tab, you can see the fifteen 15 calculators in this Chrome Extension. I built it in a simple format to make quick calculations. Now investors and traders have the ability to calculate their stats in one tab. Obviously these formulas have more nuance than the typical retirement calculator. I wanted a better way to assess value. Which meant these 15 valuation formulas would be a great place to start. The plan is to add more as the need arises. Which it will. I have +100 calculators I would like to upload to this extension. The last tab is to analyze the impact on stock prices. This is still in development but I wanted to roll it out for production. This simple formula is something investors test for quite often in a spreadsheet.
You’ve probably seen a Scenario Analysis table, right? Where the valuation changes, depending on the growth rate and cost of capital. Well, if you have ever built a financial model before then you might be familiar with the terms, operating leverage and contribution margin. Investors analyze the operating leverage of a business to understand the key drivers in a business. In this case, it’s the net income. If earnings go up or down by 5%, it doesn’t have a linear impact on the stock price. You see this during earrings seasons. The earnings per share (EPS) can introduce tremendous volatility to the stock price. These were the quickest calculations I could come up with. They were also the most common calculations I made on a constant basis. If you want to check out the Investment Calculator, you can download it as Chrome Extension. |
Welcome to Golden Door
Learn about the latest technology investments here.
ADBE Return on Equity Analysis: Navigating the Digital Media Landscape A daily market insight into Adobe's financial performance, growth prospects, and competitive positioning. 6/10/2025 Daily Market Insights Your daily dose of market intelligence6/10/2025 Return on Equity Scorecard: ADBE Adobe (ADBE): A Creative Powerhouse in a Shifting Landscape Adobe (ADBE) remains a dominant player in the digital media and marketing solutions space, but recent performance reveals a nuanced picture. While...
Navigating Market Turbulence: A Daily Briefing Inflation, Rates, and Recession Risks: Expert Insights for Informed Investing 6/9/2025 Daily Market Insights Your daily dose of market intelligence6/9/2025 Executive Summary The market currently navigates a complex landscape characterized by persistent inflation, rising interest rates, and slowing economic growth, creating a challenging environment for investors. The Federal Reserve's hawkish stance to combat inflation, while necessary, increases...
Market Navigator: Daily Economic Briefing Navigating Inflation, Rate Hikes, and Market Volatility 6/4/2025 Daily Market Insights Your daily dose of market intelligence6/4/2025 Executive Summary The market is currently navigating a complex landscape characterized by persistent inflation, rising interest rates, and slowing economic growth, leading to increased volatility and investor uncertainty. While recent inflation data suggests a potential peak, the Federal Reserve remains committed to its...